Solution in MATLAB Environment
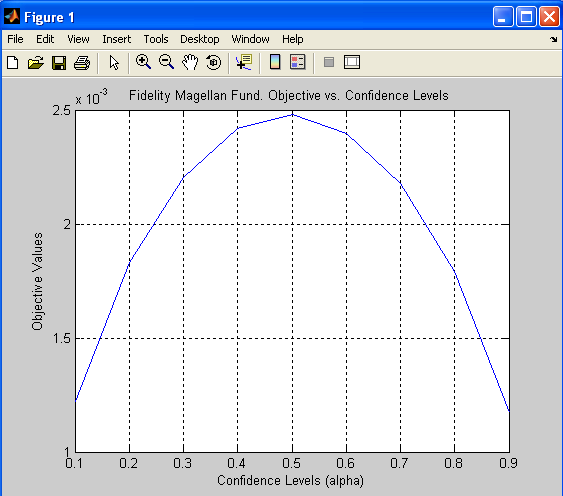
Table 1. Fidelity Magellan Fund. Optimal Objective Values
Table 2. Fidelity Magellan Fund. Probability of Exceeding of alpha-quantile
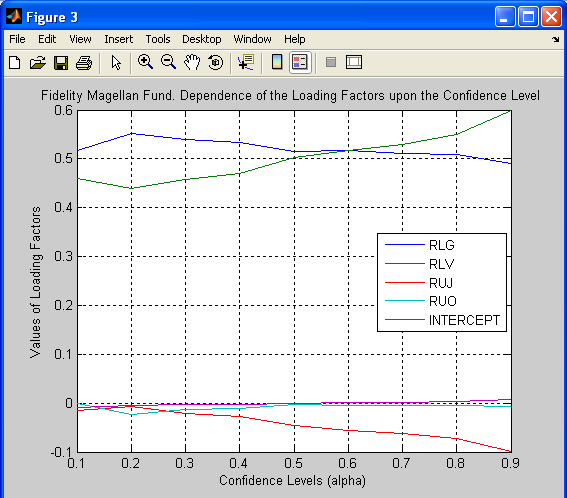
Table 3. Fidelity Magellan Fund. Dependence of the Loading Factors upon the Confidence Level
Table 4. S&P 500 Index. Optimal Objective Values
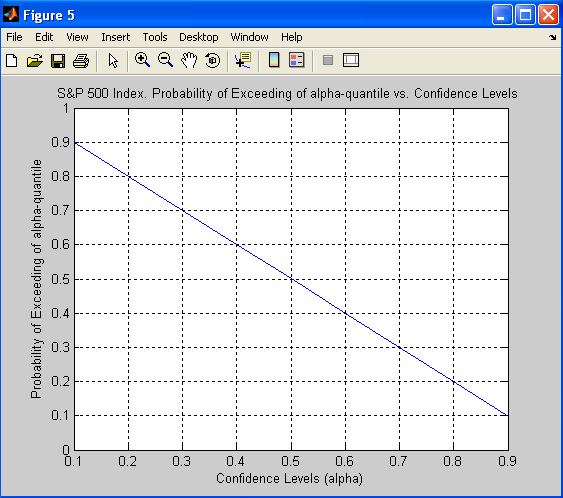
Table 5. S&P 500 Index. Probability of Exceeding of alpha-quantile
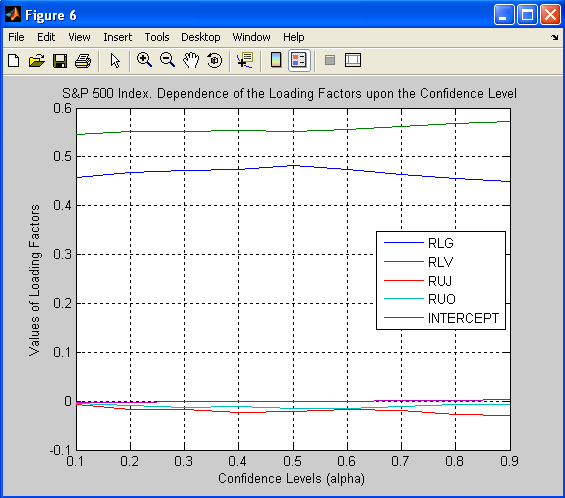
Table 6. S&P 500 Index. Dependence of the Loading Factors upon the Confidence Level
Figure 1. Fidelity Magellan Fund. Optimal Objective Values
Figure 2. Fidelity Magellan Fund. Probability of Exceeding of alpha-quantile
Figure 3. Fidelity Magellan Fund. Dependence of the Loading Factors upon the Confidence Level
Figure 4. S&P 500 Index. Optimal Objective Values
Figure 5. S&P 500 Index. Probability of Exceeding of alpha-quantile
Figure 6. S&P 500 Index. Dependence of the Loading Factors upon the Confidence Level
Case study Style Classification with Quantile Regression (see Formal Problem Statement) in MATLAB Environment is solved with tbpsg_run PSG function.
Main MATLAB code is in file CS_Style_Classification_Quantile_Regression_PM_Toolbox.m.
Data are saved in file Style_Classification_Quantile_Regression_PM_data_Toolbox.mat.
Let us describe the main operations. To run case study you need to do the following main steps:
In file CS_Style_Classification_Quantile_Regression_PM_Toolbox.m:
Load data:
load Style_Classification_Quantile_Regression_PM_data_Toolbox.mat
Set values of confidence level in quantile regression:
alpha = [0.1 0.2 0.3 0.4 0.5 0.6 0.7 0.8 0.9];
Start cycle for confidence levels:
for i=1:length(alpha)
Generate problem statement for Fidelity Magellan Fund:
str1 = sprintf('Problem: problem_1, type = minimize');
str2 = sprintf('Objective: objective_1');
str3 = sprintf('%.1f%s', alpha(i),'*pm_pen_Magellan(0.0, matrix_style_classification_fidelity_magellan)');
str4 = sprintf('%.1f%s', (1-alpha(i)),'*pm_pen_g_Magellan(0.0, matrix_style_classification_fidelity_magellan)');
str5 = sprintf('Box_of_Variables:');
str6 = sprintf('Solver: VAN, precision = 5');
clear problem_statement;
problem_statement = sprintf('%s\n', str1, str2, str3, str4, str5, str6);
%Uncomment the following line to open the problem in Toolbox Window:
%tbpsg_toolbox(problem_statement,toolboxstruc_arr);
Optimize problem for Fidelity Magellan Fund:
[solution_str, outargstruc_arr] = tbpsg_run(problem_statement, toolboxstruc_arr); |
Extract optimal point for Fidelity Magellan Fund and pack it to input array of structures:
point_variables = tbpsg_optimal_point_vars(solution_str, outargstruc_arr);
loc = tbpsg_optimal_point_data(solution_str, outargstruc_arr)';
point_magellan(:,i)= loc;
toolboxstruc_arr(3) = tbpsg_point_pack('point_1',loc,point_variables);
Extract optimal objective value for Fidelity Magellan Fund:
objective_magellan(i) = tbpsg_objective(solution_str, outargstruc_arr);
Calculate probabilities of exceeding alpha-quantile for Fidelity Magellan Fund, which should be equal to 1- alpha:
probability_magellan(i) = tbpsg_function_value('pr_pen(0.0, matrix_style_classification_fidelity_magellan)', 'point_1', toolboxstruc_arr);
Generate problem statement for S&P 500 index:
str1 = sprintf('Problem: problem_2, type = minimize');
str2 = sprintf('Objective: objective_2');
str3 = sprintf('%.1f%s', alpha(i),'*pm_pen_SPX(0.0, matrix_style_classification_spx)');
str4 = sprintf('%.1f%s', (1-alpha(i)),'*pm_pen_g_SPX(0.0, matrix_style_classification_spx)');
str5 = sprintf('Box_of_Variables:');
str6 = sprintf('Solver: VAN, precision = 5');
clear problem_statement;
problem_statement = sprintf('%s\n', str1, str2, str3, str4, str5, str6);
%Uncomment the following line to open the problem in Toolbox Window:
%tbpsg_toolbox(problem_statement,toolboxstruc_arr);
Optimize problem for S&P 500 index:
[solution_str, outargstruc_arr] = tbpsg_run(problem_statement, toolboxstruc_arr); |
Extract optimal point for S&P 500 index and pack it to input array of structures:
clear optimal_point;
clear point_variables;
point_variables = tbpsg_optimal_point_vars(solution_str, outargstruc_arr);
loc = tbpsg_optimal_point_data(solution_str, outargstruc_arr)';
point_SP_500(:,i)= loc;
toolboxstruc_arr(4) = tbpsg_point_pack('point_2',loc,point_variables);
Extract optimal objective value for S&P 500 index:
objective_SP_500(i) = tbpsg_objective(solution_str, outargstruc_arr);
Calculate probabilities of exceeding alpha-quantile for S&P 500 index, which should be equal to 1- alpha:
probability_SP_500(i) = tbpsg_function_value('pr_pen(0.0, matrix_style_classification_spx)', 'point_2', toolboxstruc_arr);
Results of calculations are displayed in the MATLAB Command window and saved in the CS_Style_Classification_Quantile_Regression_Output.txt located in the folder with current MATLAB program.
Results of calculations are presented graphically and in form of tables:
| 1. | Optimal objective values for different confidence levels (alpha) are in Table 1 and Table 4. These values are also pictured in the graphs Figure 1 and Figure 4. |
2. Correctness of the calculations can be verified by calculating probabilities of exceeding of ![]() - quantile. According to the model, for given confidence level
- quantile. According to the model, for given confidence level ![]() , estimate of
, estimate of ![]() - quantile of Y (i.e., VaR of Y with confidence level
- quantile of Y (i.e., VaR of Y with confidence level ![]() ) under the condition that a new realization
) under the condition that a new realization ![]() is observed is equal to
is observed is equal to ![]() where the vector
where the vector ![]() is the optimal point found by this program. Since
is the optimal point found by this program. Since ![]() ,
, ![]() , the following relation should be satisfied:
, the following relation should be satisfied:
![]() .
.
Thus probability of exceeding of ![]() - quantile should be equal to 1 -
- quantile should be equal to 1 -![]() . Results of calculations of
. Results of calculations of ![]() are in Table 2 and Table 5. These values are pictures in graphs Figure 2 and Figure 5.
are in Table 2 and Table 5. These values are pictures in graphs Figure 2 and Figure 5.
3. Estimated coefficients (loading factors) represent the fund’s style with respect to each of the indices. They are in Table 3 and Table 6. These values are also pictures in graphs Figure 3 and Figure 6.
Table 1. Fidelity Magellan Fund. Optimal Objective Values
Alpha Optimal Objective
0.1 0.00122086
0.2 0.00183014
0.3 0.00220388
0.4 0.00241841
0.5 0.00248032
0.6 0.00239697
0.7 0.00217567
0.8 0.00178948
0.9 0.00117241
Table 2. Fidelity Magellan Fund. Probability of Exceeding of alpha-quantile
Alpha Probability of Exceeding of alpha-quantile
0.1 0.89873418
0.2 0.79825949
0.3 0.69962640
0.4 0.59889241
0.5 0.49762658
0.6 0.40048362
0.7 0.29746835
0.8 0.20042194
0.9 0.09810127
Table 3. Fidelity Magellan Fund. Dependence of the Loading Factors upon the Confidence Level
alpha intercept rlg rlv ruj ruo
0.1 -0.00892393 0.51768462 0.46020583 -0.01561369 0.00009856
0.2 -0.00563671 0.55241315 0.43882833 -0.00758148 -0.02421845
0.3 -0.00378221 0.53844167 0.45752222 -0.02093458 -0.01270175
0.4 -0.00233426 0.53309851 0.46968344 -0.02741708 -0.01069027
0.5 -0.00078699 0.51481387 0.50290280 -0.04584512 -0.00329544
0.6 0.00064645 0.51681182 0.51607406 -0.05681132 -0.00393443
0.7 0.00205902 0.51160154 0.53002525 -0.06287904 -0.00460856
0.8 0.00402991 0.50815787 0.54972695 -0.07268297 -0.00551968
0.9 0.00670500 0.48992031 0.59801638 -0.09847591 -0.00667862
Table 4. S&P 500 Index. Optimal Objective Values
Alpha Optimal Objective
0.1 0.00060935
0.2 0.00081756
0.3 0.00095714
0.4 0.00104468
0.5 0.00107951
0.6 0.00105662
0.7 0.00096867
0.8 0.00080742
0.9 0.00053512
Table 5. S&P 500 Index. Probability of Exceeding of alpha-quantile
Alpha Probability of Exceeding of alpha-quantile
0.1 0.89794304
0.2 0.80109826
0.3 0.69778481
0.4 0.60047468
0.5 0.50004108
0.6 0.40018539
0.7 0.29746835
0.8 0.19936236
0.9 0.09810127
Table 6. S&P 500 Index. Dependence of the Loading Factors upon the Confidence Level
alpha intercept rlg rlv ruj ruo
0.1 -0.00363049 0.45678095 0.54526265 -0.00719878 -0.00395236
0.2 -0.00229446 0.46727107 0.55282801 -0.01627811 -0.00909308
0.3 -0.00170422 0.47187956 0.55231844 -0.01682724 -0.01191111
0.4 -0.00113391 0.47376550 0.55469598 -0.02250040 -0.01058328
0.5 -0.00051395 0.48159646 0.55165615 -0.02125271 -0.01512512
0.6 -0.00001647 0.47522879 0.55474480 -0.01682194 -0.01556770
0.7 0.00052282 0.46372677 0.56204085 -0.01862202 -0.01114325
0.8 0.00142136 0.45599632 0.56880433 -0.02719333 -0.00646054
0.9 0.00285222 0.44973354 0.57223370 -0.03027773 -0.00724683
Figure 1. Fidelity Magellan Fund. Optimal Objective Values

Figure 2. Fidelity Magellan Fund. Probability of Exceeding of alpha-quantile

Figure 3. Fidelity Magellan Fund. Dependence of the Loading Factors upon the Confidence Level

Figure 4. S&P 500 Index. Optimal Objective Values

Figure 5. S&P 500 Index. Probability of Exceeding of alpha-quantile

Figure 6. S&P 500 Index. Dependence of the Loading Factors upon the Confidence Level

