Solution in MATLAB Environment
Table 1. Optimal Crop Production and Insurance Coverage for El Nino Climate Type
Table 2. Optimal Crop Production and Insurance Coverage for La Nina Climate Type
Table 3. Optimal Crop Production and Insurance Coverage for Neutral Climate Type
Figure 1. El Nino Climate Type. Expected Profit vs. CVaR Risk@90%
Figure 2. El Nino Climate Type. Expected Profit vs. PrPen@600
Figure 3. El Nino Climate Type. Expected Profit vs. VaR Risk@90%
Figure 4. La Nino Climate Type. Expected Profit vs. CVaR Risk@90%
Figure 5. La Nino Climate Type. Expected Profit vs. PrPen@600
Figure 6. La Nino Climate Type. Expected Profit vs. VaR Risk@90%
Figure 7. Neutral Climate Type. Expected Profit vs. CVaR Risk@90%
Figure 8. Neutral Climate Type. Expected Profit vs. PrPen@600
Figure 9. Neutral Climate Type. Expected Profit vs. VaR Risk@90%
Figure 10. El Nino Climate Type. Contributions to CVaR Risk@90% of Optimal Solution Components
Figure 11. La Nino Climate Type. Contributions to CVaR Risk@90% of Optimal Solution Components
Figure 12. Neutral Climate Type. Contributions to CVaR Risk@90% of Optimal Solution Components
Figure 13. El Nino Climate Type. Nonzero Components of Optimal Solution Obtained with CVaR Risk@90%
Figure 14. El Nino Climate Type. Nonzero Components of Optimal Solution Obtained with PrPen@600
Figure 15. El Nino Climate Type. Nonzero Components of Optimal Solution Obtained with VaR@90%
Figure 16. La Nino Climate Type. Nonzero Components of Optimal Solution Obtained with CVaR Risk@90%
Figure 17. La Nino Climate Type. Nonzero Components of Optimal Solution Obtained with PrPen@600
Figure 18. La Nino Climate Type. Nonzero Components of Optimal Solution Obtained with VaR@90%
Figure 19. Neutral Climate Type. Nonzero Components of Optimal Solution Obtained with CVaR Risk@90%
Figure 20. Neutral Climate Type. Nonzero Components of Optimal Solution Obtained with PrPen@600
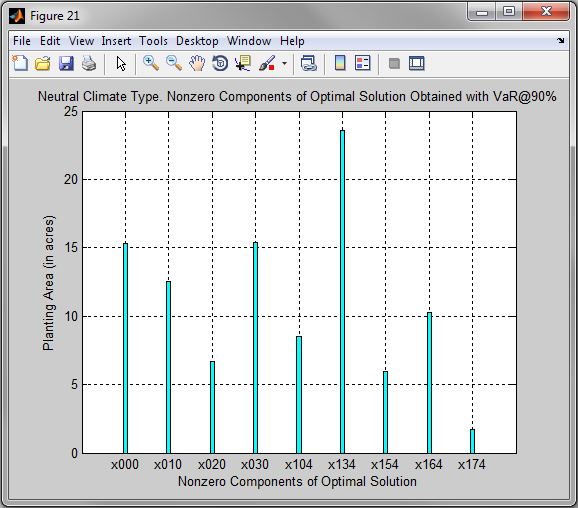
Figure 21. Neutral Climate Type. Nonzero Components of Optimal Solution Obtained with VaR@90%
Case study Optimal Crop Production and Insurance Coverage (see Formal Problem Statement) in MATLAB Environment is solved with tbpsg_run PSG subroutine.
We solve three optimization problems:
| • | risk constraint on cvar_risk (CS.5); |
| • | risk constraint on pr_pen (CS.6); |
| • | risk constraint on var_risk (CS.7). |
Crop yields are affected by climate type. Three data sets are used:
| • | matrix 'matrix_scenarios_el' containing the profit scenarios under the El Nino climate phase; |
| • | matrix 'matrix_scenarios_la' containing the profit scenarios under the La Nina climate phase; |
| • | matrix 'matrix_scenarios_nt' containing the profit scenarios under the Neutral climate phase. |
Main MATLAB code is in file CS_Crop_Insurance_PR_PEN_VaR_CVaR_Cardinality_Toolbox.m.
Data are saved in file Crop_Insurance_data_Toolbox.mat.
Let us describe the main operations. To run case study you need to do the following main steps:
In file CS_Crop_Insurance_PR_PEN_VaR_CVaR_Cardinality_Toolbox.m:
Load data:
load Crop_Insurance_data_Toolbox.mat
Generate list of matrices names used in objective:
str_ = ['matrix_obj_el ' 'matrix_obj_el ' 'matrix_obj_el ' 'matrix_obj_la ' 'matrix_obj_la ' 'matrix_obj_la ' 'matrix_obj_nt ' 'matrix_obj_nt ' 'matrix_obj_nt'];
matrix_obj = strread(str_,'%s');
Generate list of matrices names used in risk constraint:
clear str_;
str_ = ['matrix_scenarios_el ' 'matrix_scenarios_el ' 'matrix_scenarios_el ' 'matrix_scenarios_la ' 'matrix_scenarios_la ' 'matrix_scenarios_la ' 'matrix_scenarios_nt ' 'matrix_scenarios_nt ' 'matrix_scenarios_nt'];
matrix_scen = strread(str_,'%s');
Generate list of fragments of risk functions with parameters used in problem description:
clear str_;
str_ = ['cvar_risk_1(0.9, ' 'pr_pen_1(600, ' 'var_risk_1(0.9, ' 'cvar_risk_1(0.9, ' 'pr_pen_1(600, ' 'var_risk_1(0.9, ' 'cvar_risk_1(0.9, ' 'pr_pen_1(600, ' 'var_risk_1(0.9, '];
risk_finction = strread(str_,'%s');
Generate lists of problem parameters:
clear str_;
str_ = ['6000 ' '0.1 ' '925.226 ' '6000 ' '0.12 ' '737.146 ' '6000 ' '0.1 ' '-552.586 '];
risk_upper = strread(str_, '%s');
clear str_;
str_ = ['Apr,16 ' 'Apr,23 ' 'May,1 ' 'May,8 ' 'May,15 ' 'May,22 ' 'May,29 ' 'Jun,5 ' 'Jun,12'];
planting_dates = strread(str_, '%s');
clear str_;
str_ = ['cotton ' 'peanut'];
crop_type = strread(str_, '%s');
clear str_;
str_ = ['No_insurance ' 'CAT ' '65%APH ' '70%APH ' '75%APH ' '65%CRC ' '70%CRC ' '75%CRC ' '80%CRC ' '85%CRC ' ];
insurance_policy = strread(str_, '%s');
Generate the first problem statement:
str1 = sprintf('Problem: problem_crop_insurance, type = maximize');
str2 = sprintf('Objective: objective_max_profit');
str3 = sprintf('%s%s%s','linear_obj(',matrix_obj{1},')');
str4 = sprintf('Constraint: constraint_acreage_cotton, lower_bound = 50, upper_bound = 50');
str5 = sprintf('linear_acreage_cotton(matrix_acreage_cotton)');
str6 = sprintf('Constraint: constraint_acreage_peanut, lower_bound = 50, upper_bound = 50');
str7 = sprintf('linear_acreage_peanut(matrix_acreage_peanut)');
str8 = sprintf('%s%s%s','Constraint: constraint_risk, upper_bound = ',risk_upper{1}, ', linearize = 1');
str9 = sprintf('%s%s%s',risk_finction{1}, matrix_scen{1},')');
str10 = sprintf('Constraint: constraint_acreage_xa, upper_bound = 0');
str11 = sprintf('linearmulti_matrix_acreage_xa(matrix_acreage_xa)');
str12 = sprintf('Constraint: constraint_cardinality_cotton, upper_bound = 1, linearize = 1');
str13 = sprintf('cardn_pos_matrix_cardinality_cotton(0.000001, matrix_cardinality_cotton)');
str14 = sprintf('Constraint: constraint_cardinlity_peanut, upper_bound = 1, linearize = 1');
str15 = sprintf('cardn_pos_matrix_cardinality_peanut(0.000001, matrix_cardinality_peanut)');
str16 = sprintf('Box_of_Variables: lowerbounds = point_lb, upperbounds = point_ub');
str17 = sprintf('Solver: TANK, precision = 9, stages = 30');
clear problem_statement;
problem_statement = sprintf('%s\n', str1, str2, str3, str4, str5, str6, str7, str8, str9, str10, str11, str12, str13, str14, str15, str16, str17);
%Uncomment the following line to open the problem in Toolbox Window:
%tbpsg_toolbox(problem_statement,toolboxstruc_arr);
Optimize first problem:
[solution_str, outargstruc_arr] = tbpsg_run(problem_statement, toolboxstruc_arr); |
Extract optimal solution of the first problem:
point_variables = tbpsg_optimal_point_vars(solution_str, outargstruc_arr);
expected_profit(1) = tbpsg_objective(solution_str, outargstruc_arr);
constr_data = tbpsg_constraints_data(solution_str, outargstruc_arr);
risk(1) = constr_data(3);
point_data = tbpsg_optimal_point_data(solution_str, outargstruc_arr);
for j=1:size(point_data,2)
point_solution(j,1)=0;
if abs(point_data(j)) > 0
if log10(abs(point_data(j)))> -precision
point_solution(j,1)= point_data(j);
end
end
end
Begin loop over other problems:
for i=2:1:9
Generate case-specific fragments of the next problem statement:
clear str3;
str3 = sprintf('%s%s%s','linear_obj(',matrix_obj{i},')');
clear str8;
str8 = sprintf('%s%s%s','Constraint: constraint_risk, upper_bound = ',risk_upper{i}, ', linearize = 1');
clear str9;
str9 = sprintf('%s%s%s',risk_finction{i}, matrix_scen{i},')');
clear str17;
if i==2
str17 = sprintf('Solver: VAN, precision = 6, stages = 30');
end
if i==3
str17 = sprintf('Solver: VAN, precision = 6, stages = 30');
end
if i==4
str17 = sprintf('Solver: TANK, precision = 9, stages = 30');
end
if i==5
str17 = sprintf('Solver: VAN, precision = 6, stages = 20');
end
if i==6
str17 = sprintf('Solver: VAN, precision = 9, stages = 30');
end
if i==7
str17 = sprintf('Solver: TANK, precision = 6, stages = 20');
end
if i==8
str17 = sprintf('Solver: VAN, precision = 6, stages = 20');
end
if i==9
str17 = sprintf('Solver: VAN, precision = 6, stages = 30');
end
Assemble and verify the current problem statement:
clear problem_statement;
problem_statement = sprintf('%s\n', str1, str2, str3, str4, str5, str6, str7, str8, str9, str10, str11, str12, str13, str14, str15, str16, str17);
Optimize the current problem:
[solution_str, outargstruc_arr] = tbpsg_run(problem_statement, toolboxstruc_arr); |
Extract optimal solution of the current problem:
point_variables = tbpsg_optimal_point_vars(solution_str, outargstruc_arr);
expected_profit(i) = tbpsg_objective(solution_str, outargstruc_arr);
constr_data = tbpsg_constraints_data(solution_str, outargstruc_arr);
risk(i) = constr_data(3);
point_data = tbpsg_optimal_point_data(solution_str, outargstruc_arr);
for j=1:size(point_data,2)
point_solution(j,i)=0;
if abs(point_data(j)) > 0
if log10(abs(point_data(j)))> -precision
point_solution(j,i)= point_data(j);
end
end
end
end
Results are presented in form of tables and graphs:
| • | Optimal Crop Production and Insurance Coverage for El Nino Climate Type are in the Table 1. These results are also pictured in the graphs Figures 13, 14, 15. |
| • | Optimal Crop Production and Insurance Coverage for La Nina Climate Type are in the Table 2. These results are also pictured in the graphs Figures 16, 17, 18. |
| • | Optimal Crop Production and Insurance Coverage for Neutral Climate Type are in the Table 3. These results are also pictured in the graphs Figures 19, 20, 21. |
| • | Figures 1 - 9 compare optimal solutions of the corresponding problems in risk-expected profit coordinates. |
| • | Figures 10-12 show contributions of components of optimal solutions to the corresponding risk. |
| • |
Table 1. Optimal Crop Production and Insurance Coverage for El Nino Climate Type.
Planting area (in acres)
Variable Crop Type Planting Date Insurance Policy CVaR PrPen VaR
x000 cotton Apr,16 No_insurance 50.00 0.00 17.42
x006 cotton Apr,16 70%CRC 0.00 12.76 0.00
x010 cotton Apr,23 No_insurance 0.00 0.00 19.20
x016 cotton Apr,23 70%CRC 0.00 12.50 0.00
x020 cotton May,1 No_insurance 0.00 0.00 13.38
x026 cotton May,1 70%CRC 0.00 12.41 0.00
x036 cotton May,8 70%CRC 0.00 12.33 0.00
x120 peanut May,1 No_insurance 0.00 4.44 0.00
x130 peanut May,8 No_insurance 0.00 7.29 0.00
x134 peanut May,8 75%APH 3.40 0.00 0.00
x140 peanut May,15 No_insurance 0.00 7.10 0.00
x150 peanut May,22 No_insurance 0.00 15.48 0.00
x154 peanut May,22 75%APH 2.67 0.00 4.44
x160 peanut May,29 No_insurance 0.00 3.33 0.00
x164 peanut May,29 75%APH 13.01 0.00 15.18
x170 peanut Jun,5 No_insurance 0.00 12.37 0.00
x174 peanut Jun,5 75%APH 30.93 0.00 30.38
Table 2. Optimal Crop Production and Insurance Coverage for La Nina Climate Type.
Planting area (in acres)
Variable Crop Type Planting Date Insurance Policy CVaR PrPen VaR
x000 cotton Apr,16 No_insurance 0.00 0.03 12.28
x010 cotton Apr,23 No_insurance 0.00 13.54 12.10
x020 cotton May,1 No_insurance 0.00 7.50 12.33
x030 cotton May,8 No_insurance 50.00 28.93 13.29
x133 peanut May,8 70%APH 0.00 0.90 0.00
x134 peanut May,8 75%APH 5.88 0.00 2.62
x143 peanut May,15 70%APH 0.00 32.24 0.00
x144 peanut May,15 75%APH 27.41 0.00 21.56
x153 peanut May,22 70%APH 0.00 5.51 0.00
x154 peanut May,22 75%APH 6.73 0.00 19.10
x163 peanut May,29 70%APH 0.00 11.35 0.00
x164 peanut May,29 75%APH 9.98 0.00 6.72
Table 3. Optimal Crop Production and Insurance Coverage for Neutral Climate Type.
Planting area (in acres)
Variable Crop Type Planting Date Insurance Policy CVaR PrPen VaR
x000 cotton Apr,16 No_insurance 8.47 21.53 15.32
x010 cotton Apr,23 No_insurance 34.17 14.03 12.56
x020 cotton May,1 No_insurance 7.36 7.14 6.72
x030 cotton May,8 No_insurance 0.00 7.30 15.41
x104 peanut Apr,16 75%APH 5.56 16.35 8.51
x114 peanut Apr,23 75%APH 0.07 0.00 0.00
x124 peanut May,1 75%APH 6.10 0.00 0.00
x134 peanut May,8 75%APH 12.05 22.50 23.56
x144 peanut May,15 75%APH 4.74 0.00 0.00
x154 peanut May,22 75%APH 14.26 2.62 5.97
x164 peanut May,29 75%APH 5.23 8.52 10.24
x174 peanut Jun,5 75%APH 2.00 0.00 1.72
Figure 1. El Nino Climate Type. Expected Profit vs. CVaR Risk@90%
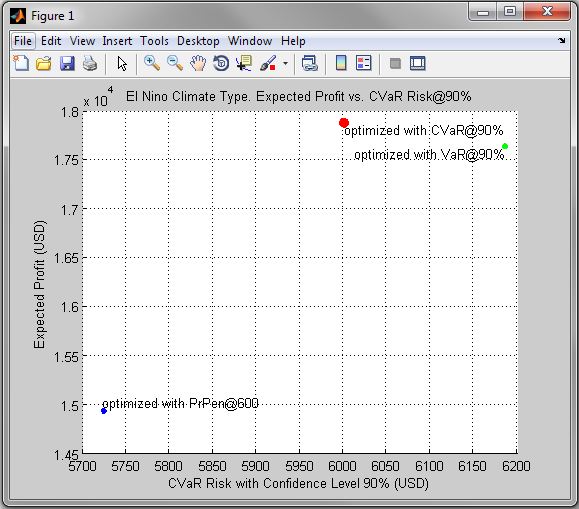
Figure 2. El Nino Climate Type. Expected Profit vs. PrPen@600
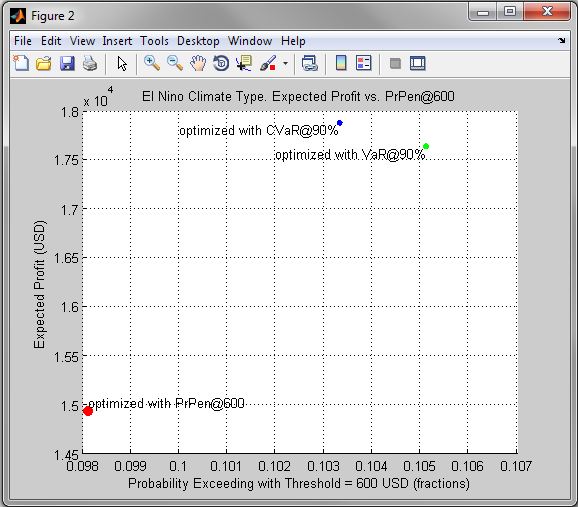
Figure 3. El Nino Climate Type. Expected Profit vs. VaR Risk@90%
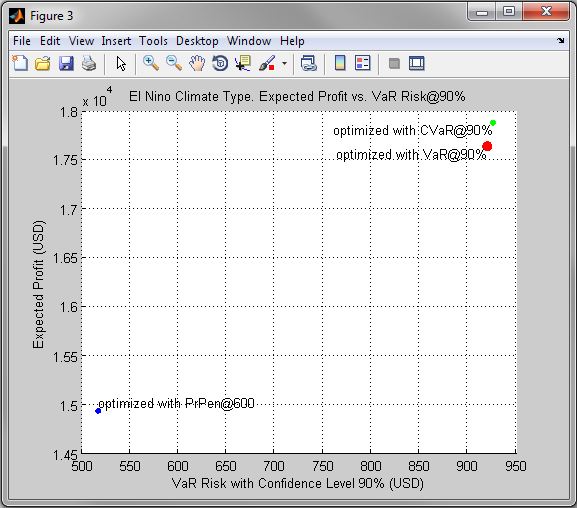
Figure 4. La Nino Climate Type. Expected Profit vs. CVaR Risk@90%
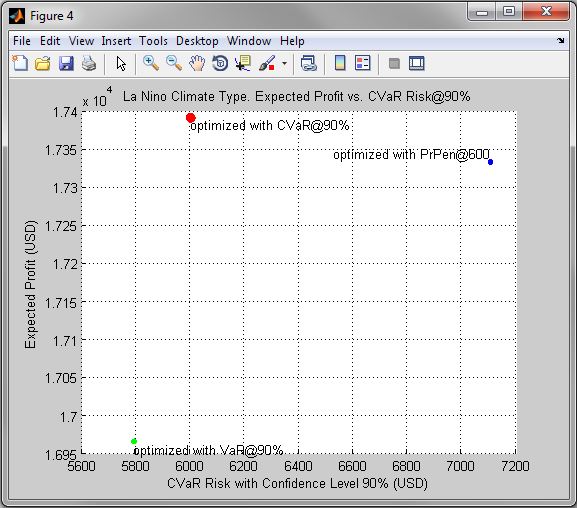
Figure 5. La Nino Climate Type. Expected Profit vs. PrPen@600
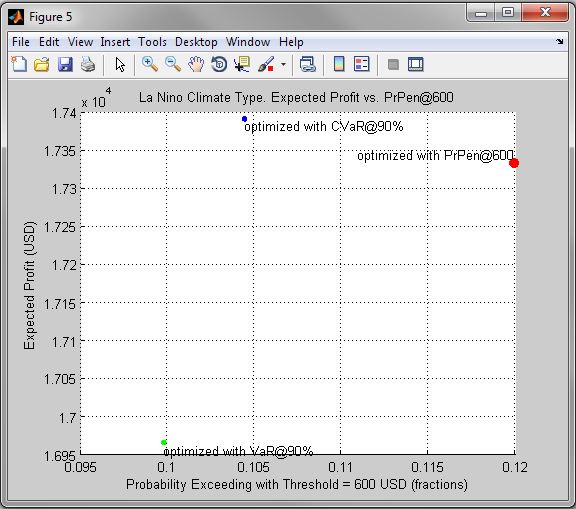
Figure 6. La Nino Climate Type. Expected Profit vs. VaR Risk@90%
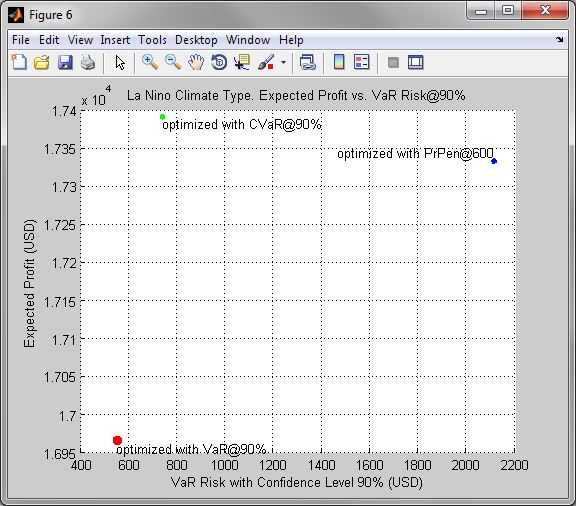
Figure 7. Neutral Climate Type. Expected Profit vs. CVaR Risk@90%
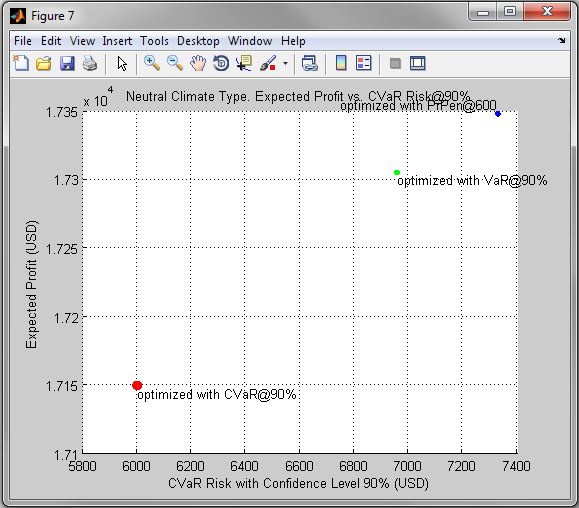
Figure 8. Neutral Climate Type. Expected Profit vs. PrPen@600
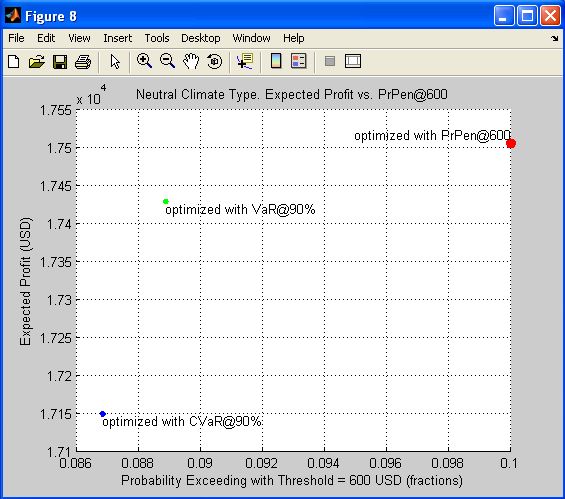
Figure 9. Neutral Climate Type. Expected Profit vs. VaR Risk@90%
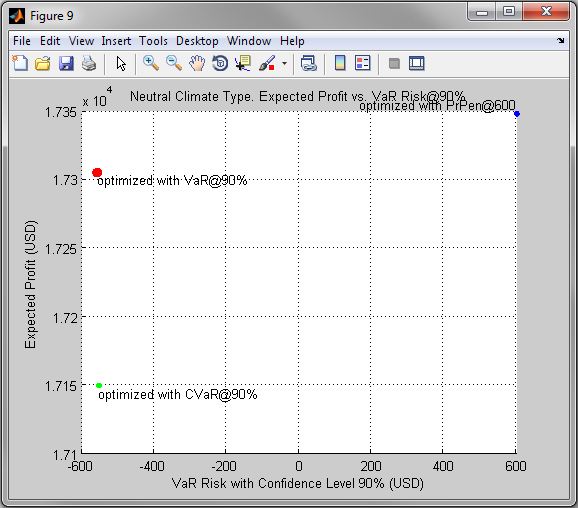
Figure 10. El Nino Climate Type. Contributions to CVaR Risk@90% of Optimal Solution Components
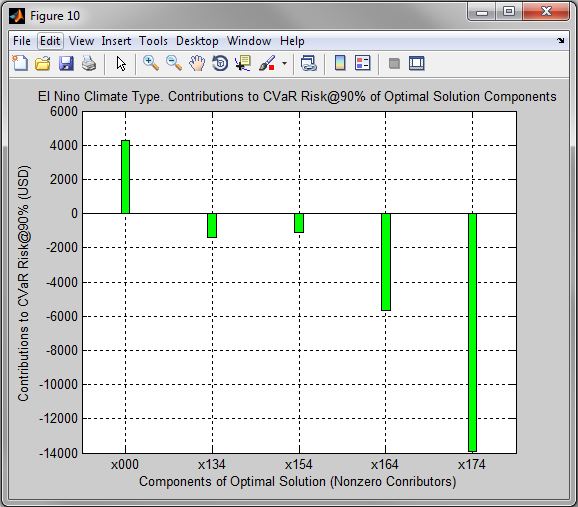
Figure 11. La Nino Climate Type. Contributions to CVaR Risk@90% of Optimal Solution Components
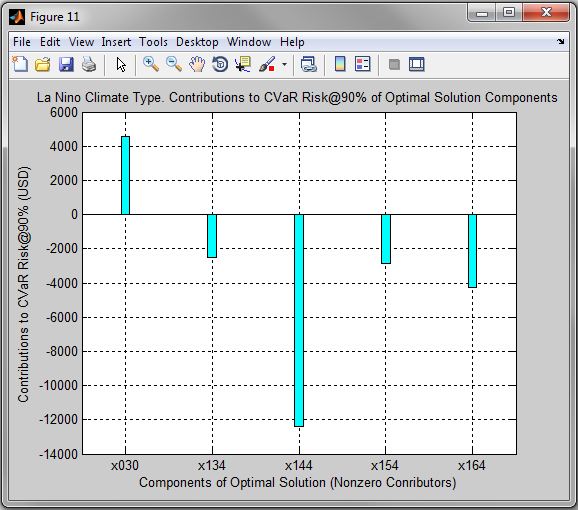
Figure 12. Neutral Climate Type. Contributions to CVaR Risk@90% of Optimal Solution Components
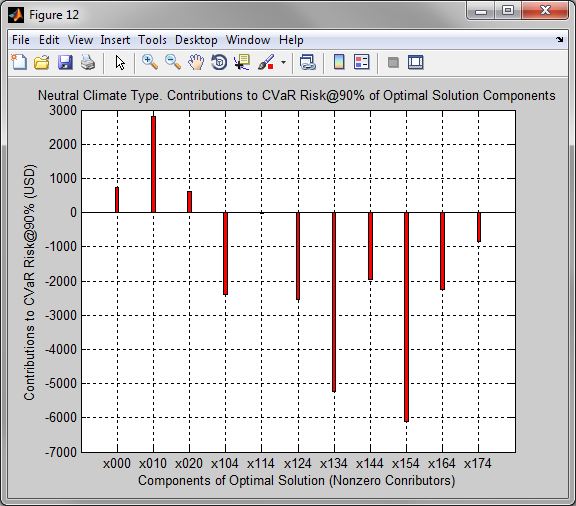
Figure 13. El Nino Climate Type. Nonzero Components of Optimal Solution Obtained with CVaR Risk@90%
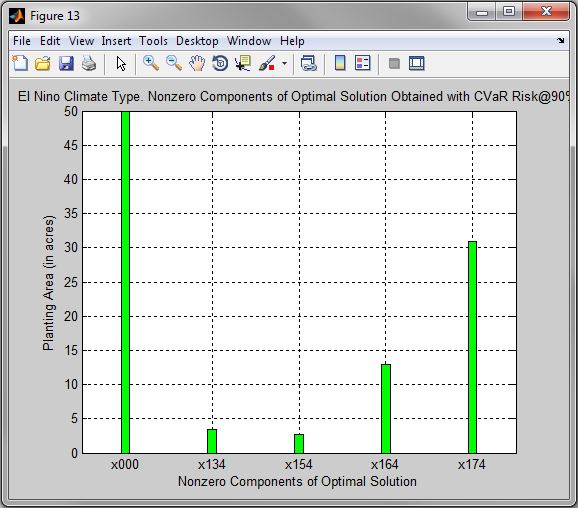
Figure 14. El Nino Climate Type. Nonzero Components of Optimal Solution Obtained with PrPen@600
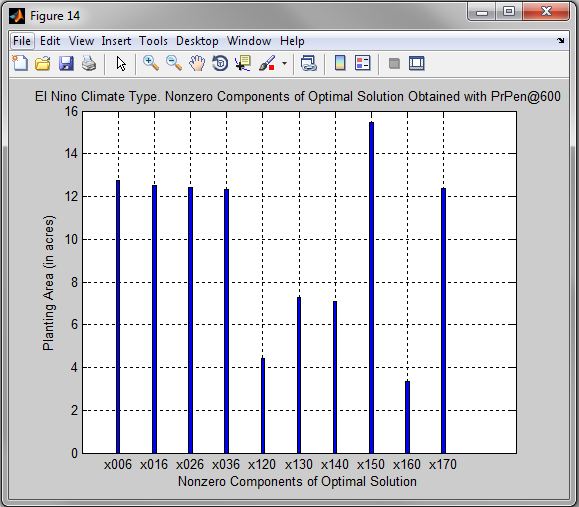
Figure 15. El Nino Climate Type. Nonzero Components of Optimal Solution Obtained with VaR@90%
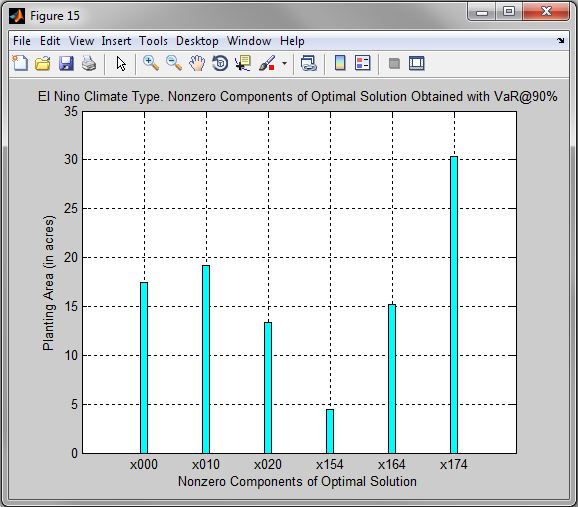
Figure 16. La Nino Climate Type. Nonzero Components of Optimal Solution Obtained with CVaR Risk@90%
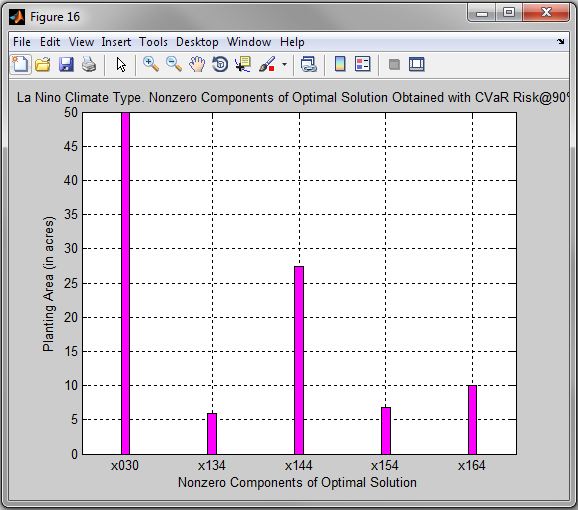
Figure 17. La Nino Climate Type. Nonzero Components of Optimal Solution Obtained with PrPen@600

Figure 18. La Nino Climate Type. Nonzero Components of Optimal Solution Obtained with VaR@90%

Figure 19. Neutral Climate Type. Nonzero Components of Optimal Solution Obtained with CVaR Risk@90%
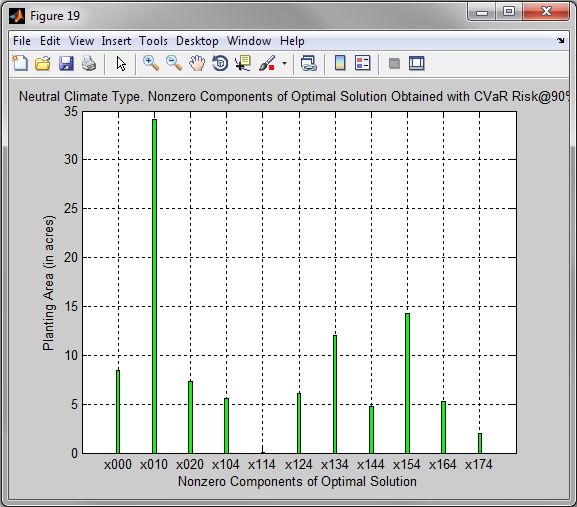
Figure 20. Neutral Climate Type. Nonzero Components of Optimal Solution Obtained with PrPen@600
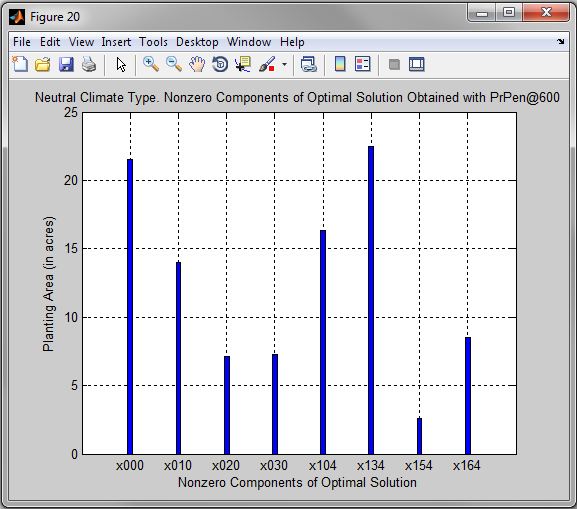
Figure 21. Neutral Climate Type. Nonzero Components of Optimal Solution Obtained with VaR@90%
