Solution in MATLAB Environment
Table 1. Solutions of the Problem 1
Table 2. Solutions of the Problem 2
Table 3. Solutions of the Problem 3
Figure 1. Efficient Frontier for Problem 1
Figure 2. Efficient Frontier for Problem 2
Figure 3. Efficient Frontier for Problem 3
Figure 4. Comparison of Efficient Frontiers
Figure 6. Relative Contribution to CVaR Dev.
Figure 7. Relative Contribution to Std. Dev.
Figure 8. Std. Dev Marginal (for Non-Zero Components)
Figure 9. CVaR Dev Marginal (for Non-Zero Components)
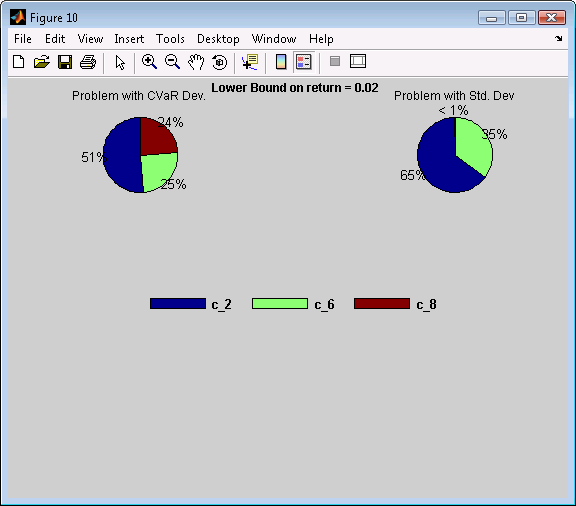
Figure 10. Lower Bound on return = 0.02
Case study Portfolio Optimization, CVaR vs Standard Deviation (see Formal Problem Statement) in MATLAB Environment is solved with riskparam PSG subroutine and includes three risk minimization problems:
| • | Problem 1 (CS.1 - CS.4): risk is measured by CVaR deviation. |
| • | Problem 2 (CS.5 - CS.8): risk is measured by standard deviation calculated by using the covariance matrix. |
| • | Problem 3 (CS.9 - CS.12): risk is measured by standard deviation calculated with the matrix of scenarios. |
MATLAB code for Portfolio Optimization with Nonlinear Transaction Costs is in file CS_Portfolio_Optimization_CVaR_vs_ST_DEV.m.
Data are saved in files Portfolio_Optimization_CVaR_vs_ST_DEV.mat.
All three problems are run with several values of r = 0.01, 0.015, 0.02, 0.021, 0.022, 0.023, 0.024, 0.025, 0.026, 0.027, 0.028, 0.029, 0.03, 0.035, 0.036, and 0.037 in the constraints (CS.3), (CS.7), and (CS.11), correspondingly.
Let us describe the main operations. To run case study you need to do the following main steps:
In file CS_Portfolio_Optimization_CVaR_vs_ST_DEV.m :
Specify a set of values of parameter parameter (upper bound on risk) for which runs should be conducted:
Parameters_pos = [0.01 0.015 0.02 0.021 0.022 0.023 0.024...
0.025 0.026 0.027 0.028 0.029 0.03 0.035 0.036 0.037];
Change the sign of parameter (constraint on the portfolio rate of return) to reduce the constraint (CS.2) to the form used by riskparam subroutine.
Parameters = Parameters_pos*(-1);
Load data:
load('Portfolio_Optimization_CVaR_vs_ST_DEV.mat');
Solve the optimization Problem 1 (CS.1) - (CS.4).
Set solver options:
stroptions.Solver = 'VAN';
stroptions.Precision = 5;
Set graph options:
stroptions.PlotGraph = 'On';
stroptions.PlotType = 2;
Set the scale for parameter. Since we change the parameter sign minus sign ("-") to adapt it to the standard constraint statement for riskparam function, we change sign to achieve the initial values of the parameter:
stroptions.ScaleParam = -1;
Optimize problem for specified values of the parameter:
[Objectives, Parameters, Points, GraphHandle]=riskparam ('cvar_dev', 0.99, H, c, p, [],... A, b, Aeq, beq, lb, [], 'b', [],[],[],[], [], Parameters, [], stroptions); Points_cvar = Points; |
Create string array for components:
for i=1:size(component_name_arr)
comp_alias {i} = strcat('c_',int2str(i));
end
Display the resulting table (Table 1):
n=12;
l=1;
for k=1:4
fprintf('\n%27s','Constraint on the portfolio');
fprintf('\n%27s',' rate of return');
for i=l:1:length(Parameters)-n
fprintf('%16.6f', Parameters(i));
end
fprintf('\n%27s','Portfolio CVaR deviation');
for i=l:1:length(Parameters)-n
fprintf('%16.5E', Objectives(i));
end
fprintf('\n%27s','Optimal value of components');
for j=1:size(component_name_arr)
fprintf('\n%27s', component_name_arr {j});
for i=l:1:length(Parameters)-n
fprintf('%16f', Points_cvar(i,j));
end
end
fprintf('\n');
n = n - 4;
l= l + 4;
end
fprintf('\n');
fprintf('\n');
Solve the optimization Problem 2 (CS.5) - (CS.8).
Optimize problem for specified values of the parameter:
[Objectives, Parameters, Points, GraphHandle]=riskparam ('st_dev', [], H_cov, [], [], [],... A, b, Aeq, beq, lb, [], 'b', [],[],[],[], [], Parameters, [], stroptions); Points_stdev_covar = Points; |
Display the resulting table (Table 2):
n=12;
l=1;
for k=1:4
fprintf('\n%27s','Constraint on the portfolio');
fprintf('\n%27s',' rate of return');
for i=l:1:length(Parameters)-n
fprintf('%16.6f', Parameters(i));
end
fprintf('\n%27s','Minimal risk measured');
fprintf('\n%27s','by standard deviation');
fprintf('\n%27s','calculated with the');
fprintf('\n%27s','covariance matrix');
for i=l:1:length(Parameters)-n
fprintf('%16.5E', Objectives(i));
end
fprintf('\n%27s','Optimal value of components');
for j=1:size(component_name_arr)
fprintf('\n%27s', component_name_arr {j});
for i=l:1:length(Parameters)-n
fprintf('%16f', Points_stdev_covar(i,j));
end
end
fprintf('\n');
n = n - 4;
l= l + 4;
end
fprintf('\n');
fprintf('\n');
Solve the optimization Problem 3 (CS.9) - (CS.12).
Optimize problem for specified values of the parameter:
[Objectives, Parameters, Points, GraphHandle]=riskparam ('st_dev', [], H, [], [], [],... A, b, Aeq, beq, lb, [], 'b', [],[],[],[], [], Parameters, [], stroptions); Points_stdev_scenar = Points; |
Display the resulting table:
n=12;
l=1;
for k=1:4
fprintf('\n%27s','Constraint on the portfolio');
fprintf('\n%27s',' rate of return');
for i=l:1:length(Parameters)-n
fprintf('%16.6f', Parameters(i));
end
fprintf('\n%27s','Minimal risk measured');
fprintf('\n%27s','by standard deviation');
fprintf('\n%27s','calculated with the');
fprintf('\n%27s','scenarios matrix');
for i=l:1:length(Parameters)-n
fprintf('%16.5E', Objectives(i));
end
fprintf('\n%27s','Optimal value of components');
for j=1:size(component_name_arr)
fprintf('\n%27s', component_name_arr {j});
for i=l:1:length(Parameters)-n
fprintf('%16f', Points_stdev_scenar(i,j));
end
end
fprintf('\n');
n = n - 4;
l= l + 4;
end
fprintf('\n');
fprintf('\n');
Table 1. Solutions of the Problem 1
Constraint on the portfolio
rate of return 0.010000 0.015000 0.020000 0.021000
Portfolio CVaR deviation 8.08908E-003 1.25053E-002 2.07331E-002 2.24266E-002
Optimal value of components
cluster_1 0.235648 0.011749 0.000000 0.000000
cluster_2 0.750333 0.793330 0.514213 0.446486
cluster_3 0.000000 0.000000 0.000000 0.000000
cluster_4 0.000000 0.000000 0.000000 0.000000
cluster_5 0.000000 0.000000 0.000000 0.000000
cluster_6 0.014019 0.142256 0.247457 0.261744
cluster_7 0.000000 0.000000 0.000000 0.000000
cluster_8 0.000000 0.052665 0.238329 0.291770
cluster_9 0.000000 0.000000 0.000000 0.000000
cluster_10 0.000000 0.000000 0.000000 0.000000
Constraint on the portfolio
rate of return 0.022000 0.023000 0.024000 0.025000
Portfolio CVaR deviation 2.41201E-002 2.58271E-002 2.75494E-002 2.92779E-002
Optimal value of components
cluster_1 0.000000 0.000000 0.000000 0.000000
cluster_2 0.378758 0.314791 0.255058 0.195595
cluster_3 0.000000 0.000000 0.000000 0.000000
cluster_4 0.000000 0.000000 0.000000 0.000000
cluster_5 0.000000 0.000000 0.000000 0.000000
cluster_6 0.276031 0.293249 0.313767 0.334496
cluster_7 0.000000 0.000000 0.000000 0.000000
cluster_8 0.345211 0.391960 0.431175 0.469909
cluster_9 0.000000 0.000000 0.000000 0.000000
cluster_10 0.000000 0.000000 0.000000 0.000000
Constraint on the portfolio
rate of return 0.026000 0.027000 0.028000 0.029000
Portfolio CVaR deviation 3.10216E-002 3.27653E-002 3.45089E-002 3.63177E-002
Optimal value of components
cluster_1 0.000000 0.000000 0.000000 0.000000
cluster_2 0.140728 0.085861 0.030994 0.000000
cluster_3 0.000000 0.000000 0.000000 0.000000
cluster_4 0.000000 0.000000 0.000000 0.000000
cluster_5 0.000000 0.000000 0.000000 0.000000
cluster_6 0.358808 0.383120 0.407431 0.450351
cluster_7 0.000000 0.000000 0.000000 0.000000
cluster_8 0.500464 0.531019 0.561574 0.549649
cluster_9 0.000000 0.000000 0.000000 0.000000
cluster_10 0.000000 0.000000 0.000000 0.000000
Constraint on the portfolio
rate of return 0.030000 0.035000 0.036000 0.037000
Portfolio CVaR deviation 3.82550E-002 5.01961E-002 5.28031E-002 5.55696E-002
Optimal value of components
cluster_1 0.000000 0.000000 0.000000 0.000000
cluster_2 0.000000 0.000000 0.000000 0.000000
cluster_3 0.000000 0.000000 0.000000 0.000000
cluster_4 0.000000 0.000000 0.000000 0.000000
cluster_5 0.000000 0.000000 0.000000 0.000000
cluster_6 0.517432 0.852834 0.919914 0.986994
cluster_7 0.000000 0.000000 0.000000 0.000000
cluster_8 0.482568 0.147166 0.080086 0.013006
cluster_9 0.000000 0.000000 0.000000 0.000000
cluster_10 0.000000 0.000000 0.000000 0.000000
Table 2. Solutions of the Problem 2
Constraint on the portfolio
rate of return 0.010000 0.015000 0.020000 0.021000
Minimal risk measured
by standard deviation
calculated with the
covariance matrix 2.37888E-005 3.46085E-005 4.64318E-005 4.88448E-005
Optimal value of components
cluster_1 0.151210 0.000000 0.000000 0.000000
cluster_2 0.848790 0.836625 0.648144 0.610448
cluster_3 -0.000000 -0.000000 -0.000000 -0.000000
cluster_4 0.000000 0.000000 0.000000 0.000000
cluster_5 0.000000 0.000000 -0.000000 -0.000000
cluster_6 0.000000 0.163375 0.351856 0.389552
cluster_7 -0.000000 -0.000000 -0.000000 -0.000000
cluster_8 0.000000 0.000000 0.000000 0.000000
cluster_9 0.000000 0.000000 0.000000 0.000000
cluster_10 0.000000 0.000000 -0.000000 0.000000
Constraint on the portfolio
rate of return 0.022000 0.023000 0.024000 0.025000
Minimal risk measured
by standard deviation
calculated with the
covariance matrix 5.12687E-005 5.37019E-005 5.61434E-005 5.85919E-005
Optimal value of components
cluster_1 0.000000 0.000000 0.000000 0.000000
cluster_2 0.572752 0.535055 0.497359 0.459663
cluster_3 -0.000000 -0.000000 -0.000000 -0.000000
cluster_4 0.000000 0.000000 0.000000 -0.000000
cluster_5 -0.000000 -0.000000 -0.000000 0.000000
cluster_6 0.427248 0.464945 0.502641 0.540337
cluster_7 -0.000000 -0.000000 -0.000000 -0.000000
cluster_8 0.000000 0.000000 0.000000 -0.000000
cluster_9 0.000000 0.000000 0.000000 -0.000000
cluster_10 0.000000 0.000000 0.000000 0.000000
Constraint on the portfolio
rate of return 0.026000 0.027000 0.028000 0.029000
Minimal risk measured
by standard deviation
calculated with the
covariance matrix 6.10468E-005 6.35072E-005 6.59725E-005 6.84422E-005
Optimal value of components
cluster_1 0.000000 0.000000 0.000000 0.000000
cluster_2 0.421967 0.384271 0.346574 0.308878
cluster_3 -0.000000 -0.000000 -0.000000 -0.000000
cluster_4 -0.000000 -0.000000 -0.000000 -0.000000
cluster_5 0.000000 0.000000 0.000000 -0.000000
cluster_6 0.578033 0.615729 0.653426 0.691122
cluster_7 -0.000000 -0.000000 -0.000000 -0.000000
cluster_8 -0.000000 0.000000 0.000000 0.000000
cluster_9 -0.000000 -0.000000 -0.000000 -0.000000
cluster_10 0.000000 0.000000 0.000000 0.000000
Constraint on the portfolio
rate of return 0.030000 0.035000 0.036000 0.037000
Minimal risk measured
by standard deviation
calculated with the
covariance matrix 7.09159E-005 8.33311E-005 8.58215E-005 8.83140E-005
Optimal value of components
cluster_1 0.000000 0.000000 0.000000 -0.000000
cluster_2 0.271182 0.082701 0.045005 0.007309
cluster_3 -0.000000 0.000000 0.000000 0.000000
cluster_4 0.000000 0.000000 0.000000 -0.000000
cluster_5 0.000000 -0.000000 -0.000000 0.000000
cluster_6 0.728818 0.917299 0.954995 0.992691
cluster_7 -0.000000 0.000000 0.000000 0.000000
cluster_8 0.000000 0.000000 0.000000 0.000000
cluster_9 0.000000 0.000000 0.000000 0.000000
cluster_10 -0.000000 -0.000000 -0.000000 -0.000000
Table 3. Solutions of the Problem 3
Constraint on the portfolio
rate of return 0.010000 0.015000 0.020000 0.021000
Minimal risk measured
by standard deviation
calculated with the
scenarios matrix 1.95090E-003 3.20525E-003 5.07643E-003 5.47566E-003
Optimal value of components
cluster_1 0.151210 0.008762 0.000000 0.000000
cluster_2 0.848790 0.826408 0.648144 0.607385
cluster_3 -0.000000 -0.000000 -0.000000 -0.000000
cluster_4 0.000000 -0.000000 0.000000 0.000000
cluster_5 -0.000000 -0.000000 -0.000000 0.000000
cluster_6 0.000000 0.164830 0.351856 0.387165
cluster_7 -0.000000 -0.000000 -0.000000 -0.000000
cluster_8 0.000000 0.000000 0.000000 0.005451
cluster_9 0.000000 0.000000 0.000000 0.000000
cluster_10 -0.000000 -0.000000 -0.000000 -0.000000
Constraint on the portfolio
rate of return 0.022000 0.023000 0.024000 0.025000
Minimal risk measured
by standard deviation
calculated with the
scenarios matrix 5.87832E-003 6.28360E-003 6.69101E-003 7.10020E-003
Optimal value of components
cluster_1 0.000000 0.000000 0.000000 0.000000
cluster_2 0.563271 0.519157 0.475043 0.430929
cluster_3 -0.000000 -0.000000 -0.000000 -0.000000
cluster_4 0.000000 0.000000 -0.000000 -0.000000
cluster_5 0.000000 0.000000 0.000000 -0.000000
cluster_6 0.419858 0.452552 0.485245 0.517939
cluster_7 -0.000000 -0.000000 -0.000000 -0.000000
cluster_8 0.016871 0.028291 0.039712 0.051132
cluster_9 0.000000 0.000000 0.000000 0.000000
cluster_10 -0.000000 -0.000000 0.000000 0.000000
Constraint on the portfolio
rate of return 0.026000 0.027000 0.028000 0.029000
Minimal risk measured
by standard deviation
calculated with the
scenarios matrix 7.51086E-003 7.92277E-003 8.33575E-003 8.74965E-003
Optimal value of components
cluster_1 0.000000 0.000000 0.000000 0.000000
cluster_2 0.386815 0.342701 0.298587 0.254473
cluster_3 -0.000000 -0.000000 -0.000000 -0.000000
cluster_4 -0.000000 -0.000000 -0.000000 0.000000
cluster_5 0.000000 0.000000 0.000000 -0.000000
cluster_6 0.550632 0.583326 0.616019 0.648713
cluster_7 -0.000000 -0.000000 -0.000000 -0.000000
cluster_8 0.062553 0.073973 0.085394 0.096814
cluster_9 0.000000 0.000000 0.000000 0.000000
cluster_10 0.000000 0.000000 0.000000 0.000000
Constraint on the portfolio
rate of return 0.030000 0.035000 0.036000 0.037000
Minimal risk measured
by standard deviation
calculated with the
scenarios matrix 9.16433E-003 1.12474E-002 1.16869E-002 1.21538E-002
Optimal value of components
cluster_1 0.000000 -0.000000 -0.000000 -0.000000
cluster_2 0.210359 0.000000 0.000000 0.000000
cluster_3 -0.000000 -0.000000 -0.000000 -0.000000
cluster_4 0.000000 -0.000000 0.000000 -0.000000
cluster_5 -0.000000 0.000000 0.000000 0.000000
cluster_6 0.681406 0.852834 0.919914 0.986994
cluster_7 -0.000000 -0.000000 -0.000000 0.000000
cluster_8 0.108235 0.147166 0.080086 0.013006
cluster_9 0.000000 -0.000000 -0.000000 -0.000000
cluster_10 0.000000 0.000000 0.000000 0.000000
Figure 1. Efficient Frontier for Problem 1
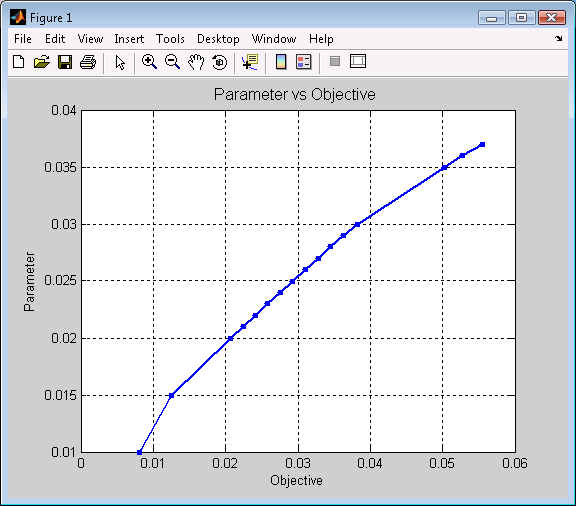
Figure 2. Efficient Frontier for Problem 2
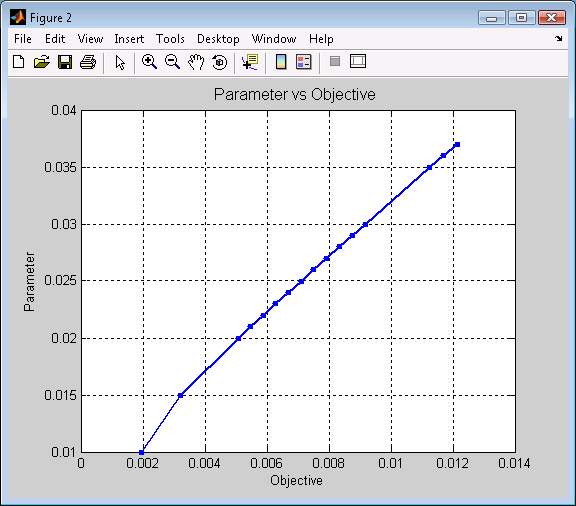
Figure 3. Efficient Frontier for Problem 3
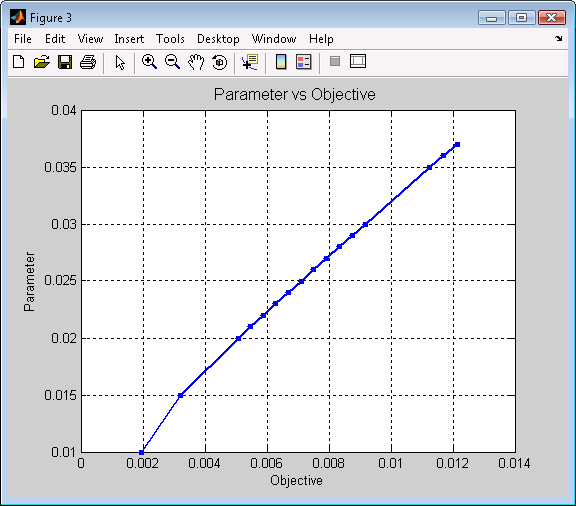
Figure 4. Comparison of Efficient Frontiers
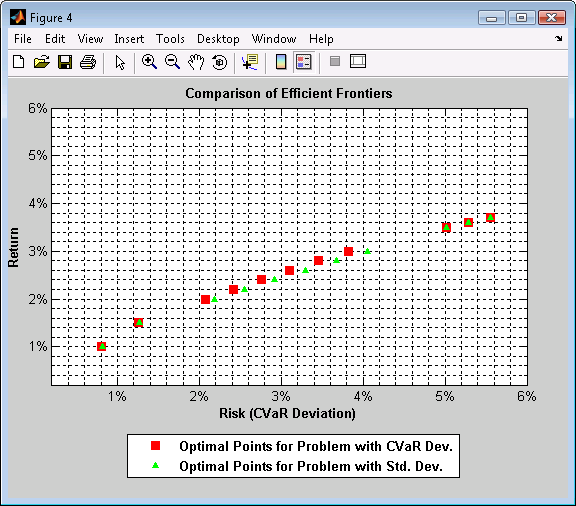
Figure 5. Difference Between Points Obtained with std. dev (with Covariance and with Matrix of Scenarios)
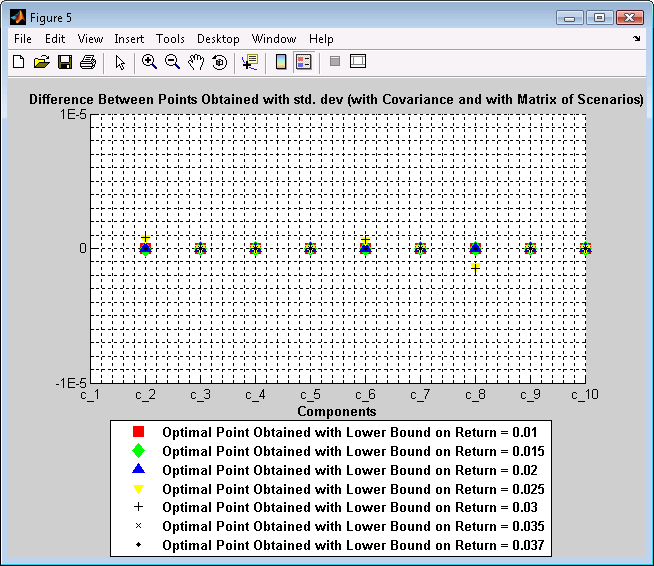
Figure 6. Relative Contribution to CVaR Dev.
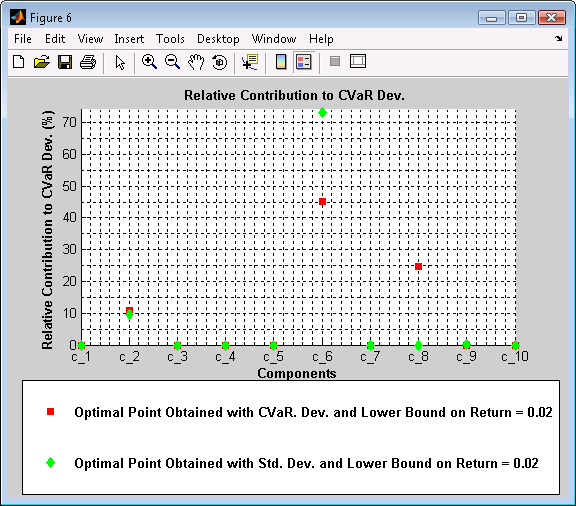
Figure 7. Relative Contribution to Std. Dev.
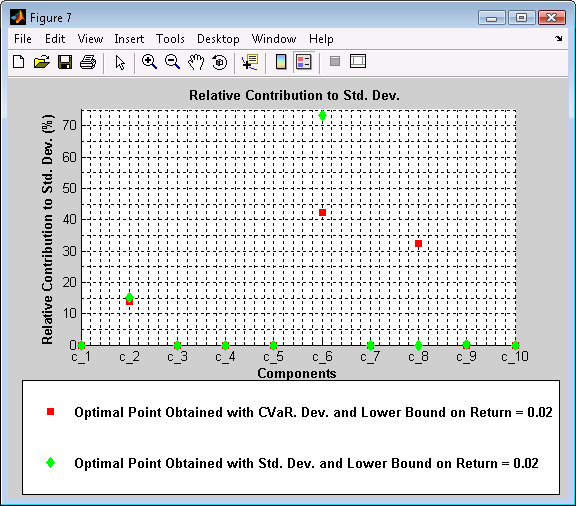
Figure 8. Std. Dev Marginal (for Non-Zero Components)
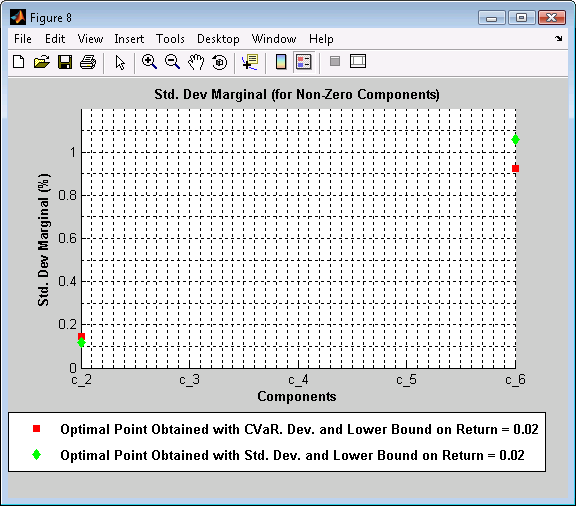
Figure 9. CVaR Dev Marginal (for Non-Zero Components)
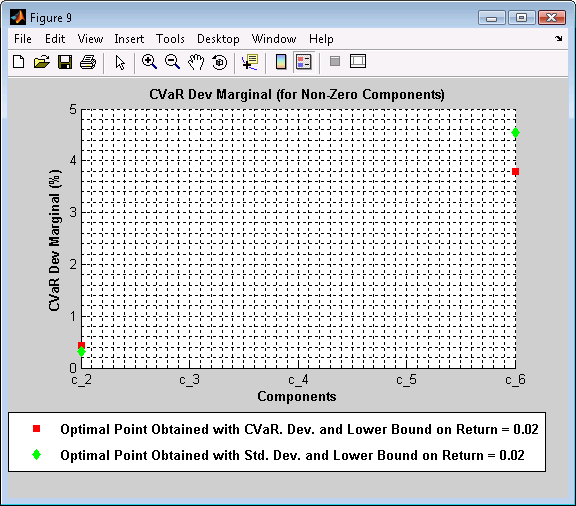
Figure 10. Lower Bound on return = 0.02
